AI Restaurant Analytics vs Traditional Reporting: From Dashboards to Decisions
Restaurants have never had more data.
Every day, a modern quick-service restaurant can generate information across:
sales
transactions
labor
online ordering
third-party delivery
menu performance
kitchen production
inventory
refunds
discounts
customer behavior
franchise performance
The problem is no longer collecting information.
The problem is understanding what it means.
Traditional restaurant reporting has made enormous progress over the past decade.
Cloud-based POS platforms allow operators to see sales almost immediately.
Multi-location groups can compare restaurants.
Executives can review KPIs without waiting for spreadsheets to be consolidated at the end of the week.
But most traditional reporting still requires a human to do the hardest part.
The report shows:
Sales are down 8%.
The operator still has to determine:
Why?
The dashboard shows:
Labor cost increased.
The executive still has to ask:
Is this a staffing problem, or did sales fall unexpectedly?
The report shows:
Delivery cancellations increased.
Someone still needs to figure out:
Was the problem kitchen capacity, menu availability, staffing, or the delivery channel itself?
Artificial intelligence changes the analytical model.
Instead of only displaying data, AI can help:
summarize it
compare it
detect anomalies
connect related metrics
identify possible drivers
forecast future outcomes
prioritize issues
answer questions in natural language
The difference is fundamental.
Traditional restaurant reporting tells you what happened. AI restaurant analytics helps you understand why it happened, what may happen next, and what you should investigate first.
That is the shift from reporting to restaurant intelligence.
Executive Summary
Traditional restaurant reporting typically follows this model:
Collect Data
↓
Build Report
↓
Review KPIs
↓
Investigate Variance
↓
Decide What to Do
AI analytics introduces additional intelligence:
Collect Data
↓
Detect Change
↓
Explain Drivers
↓
Predict Risk
↓
Prioritize
↓
Recommend Investigation or Action
The distinction is already appearing in restaurant technology.
In April 2026, Restaurant365 renamed its Intelligence product AI Dashboards and introduced AI capabilities including automated dashboard creation, AI-generated summaries, and natural-language answers about dashboard data. Restaurant365 also introduced AI labor insights designed to surface patterns across labor, guest counts, scheduled versus actual hours, overtime, and multi-location performance.
Toast's Q1 2026 data provides another signal. Across more than 125,000 U.S. restaurant locations using Toast IQ during the quarter, 47% initiated conversations about sales and revenue, 29% about operations and reporting, and 13% about labor costs and efficiency. The most common operator prompt was essentially a request for a concise daily restaurant briefing.
This suggests that operators increasingly want something beyond another dashboard.
They want the system to help interpret the business.
What Is AI Restaurant Analytics?
AI restaurant analytics uses artificial intelligence to analyze restaurant operational data, identify patterns and anomalies, explain performance changes, answer business questions, forecast outcomes, and help operators prioritize decisions.
Traditional analytics often require the user to know:
which report to open
which filters to apply
which period to compare
which metric to inspect
which other system might contain the explanation
AI changes the interface.
Instead of asking:
Where is the report that shows dinner labor variance for the last eight Thursdays?
A restaurant operator could ask:
Why has dinner labor percentage increased at our Toronto locations over the last two months?
The system could potentially analyze:
sales
scheduled labor
actual labor
transactions
average ticket
dayparts
locations
historical patterns
and return a summarized explanation.
This makes analytics more accessible to people who understand restaurant operations but are not necessarily data analysts.
Restaurant Reporting and Restaurant Analytics Are Not the Same Thing

The two terms are often used interchangeably.
They should not be.
Restaurant reporting
Reporting organizes historical information.
Typical questions include:
What were yesterday's sales?
What was labor percentage?
Which stores missed budget?
How many refunds occurred?
What was average ticket?
Which products sold most?
Reporting is essential.
It establishes the factual record.
Restaurant analytics
Analytics interprets that information.
Typical questions include:
Why did sales fall?
What is driving higher labor cost?
Why is one store outperforming comparable locations?
Which menu items are reducing throughput?
Which variance deserves attention first?
AI restaurant analytics
AI can extend the analytical layer further:
Which problems are unusual?
Which metrics appear connected?
What is likely to happen tomorrow?
Which location is most at risk?
What should leadership investigate first?
Reporting remains the foundation.
AI does not replace it.
It changes what operators can do with it.
Traditional Reporting Starts With a Report
This sounds obvious, but it creates an important limitation.
Traditional BI often requires users to navigate the system's structure.
You choose:
sales report
labor report
menu report
location report
inventory report
payment report
Then:
date range
location
comparison period
filters
That works well when the user already knows what they are looking for.
But restaurant leadership often begins with a business question instead.
Why did profitability decline last month?
That question may require information from several reports.
The answer might involve:
lower transactions
lower average ticket
higher overtime
higher food cost
increased discounting
No single report necessarily contains the answer.
The executive has to connect them.
AI analytics can reduce that analytical burden.
AI Changes the Interface From Menus to Questions
One of the most practical changes introduced by generative AI is conversational analytics.
Instead of navigating through reporting menus, users can increasingly ask questions using ordinary language.
Restaurant365's 2026 AI Dashboards include Auto Answers, allowing users to ask questions about dashboard data and receive AI-generated responses. Its Auto Dashboard feature can also create visualizations based on natural-language prompts.
Toast describes a similar direction with Toast IQ, where operators can ask questions grounded in their restaurant's sales, labor, menu, guest, and operational data.
That changes the experience dramatically.
Instead of:
Reports → Sales → Location → Date → Comparison → Export
the interface becomes:
Which five locations experienced the largest lunch sales decline this week, and what appears to be driving it?
Or:
Show locations where labor increased even though transactions declined.
Or:
Which menu items generated strong sales but appear to be associated with slower kitchen throughput?
The restaurant operator does not need to understand the database structure.
They need to understand the business question.
AI Summaries Reduce Dashboard Fatigue
Dashboards were originally designed to simplify information.
But dashboards themselves can become complicated.
A multi-location executive may open a page containing:
14 KPIs
8 charts
multiple filters
tables
trend lines
variance percentages
The executive must interpret all of it.
AI-generated summaries can invert this model.
Restaurant365's Auto Summary feature, introduced with its 2026 AI Dashboard update, generates narrative overviews of KPIs, trends, and notable changes rather than requiring users to inspect every chart independently.
That could turn a dashboard containing dozens of metrics into something closer to:
Network sales increased 3.8% this week, primarily because of higher dinner transactions in the Eastern region. Labor percentage improved 0.7 points overall, although six locations experienced significant overtime variance.
That is a very different reporting experience.
The charts are still there.
But the system helps determine what deserves attention.
From Static KPIs to Dynamic Questions
Traditional restaurant reporting is often built around predefined metrics.
Examples include:
sales
average ticket
transactions
labor percentage
food cost percentage
voids
discounts
ticket time
These KPIs remain important.
But AI makes it easier to explore relationships between them.
An operator might ask:
Did locations with longer ticket times experience lower digital order volume?
Or:
Are restaurants with higher overtime also experiencing higher employee turnover?
Restaurant365's 2026 labor-insight capabilities specifically include analysis of trends such as labor relative to guests, scheduled versus actual hours, overtime versus scheduling patterns, and correlations between turnover and overwork.
That type of analysis is more useful than simply showing the individual KPIs.
It begins connecting operating conditions.
Restaurant Analytics Should Explain Variance
Every restaurant network experiences variance.
The important question is whether the variance matters.
Imagine sales at one location fall 6%.
A traditional report highlights:
Sales: -6%
But that figure has limited operational meaning by itself.
AI analytics might investigate:
transactions
average check
menu availability
digital orders
delivery cancellations
opening hours
historical seasonality
It could determine that:
Transactions were stable.
Average check fell.
The decline was concentrated in delivery.
Several premium menu items were unavailable during dinner.
Now the problem is clearer.
The question is no longer:
Why are sales down?
It becomes:
Why were premium products unavailable during digital dinner orders?
That is a much more actionable question.
Correlation Is Not Causation
AI analytics can identify relationships.
Operators still need judgment.
Imagine the system observes:
Locations with more overtime also have slower ticket times.
That does not automatically mean overtime causes slow service.
A more likely explanation could be:
High-volume locations experience operational problems, causing both slower ticket times and additional employee hours.
The relationship is useful.
But it requires interpretation.
Responsible restaurant analytics should distinguish between:
correlation
probable contributing factor
verified cause
The AI should say:
These factors appear related and should be investigated.
Not:
This metric caused the problem.
That distinction becomes particularly important when decisions affect employees, franchisees, or financial performance.
Anomaly Detection Changes How Operators Find Problems
Traditional reporting depends heavily on thresholds.
For example:
Alert me when labor exceeds 30%.
Thresholds are useful.
But they can be crude.
Consider two locations.
Location A
Normal labor cost: 29%
Current labor cost: 31%
Location B
Normal labor cost: 21%
Current labor cost: 28%
A fixed 30% threshold flags Location A.
But Location B experienced the much more unusual change.
AI-supported anomaly detection can evaluate:
Is this normal for this restaurant?
rather than only:
Did the metric cross a universal threshold?
That makes alerts more context-aware.
Peer Benchmarking Makes Analytics More Useful
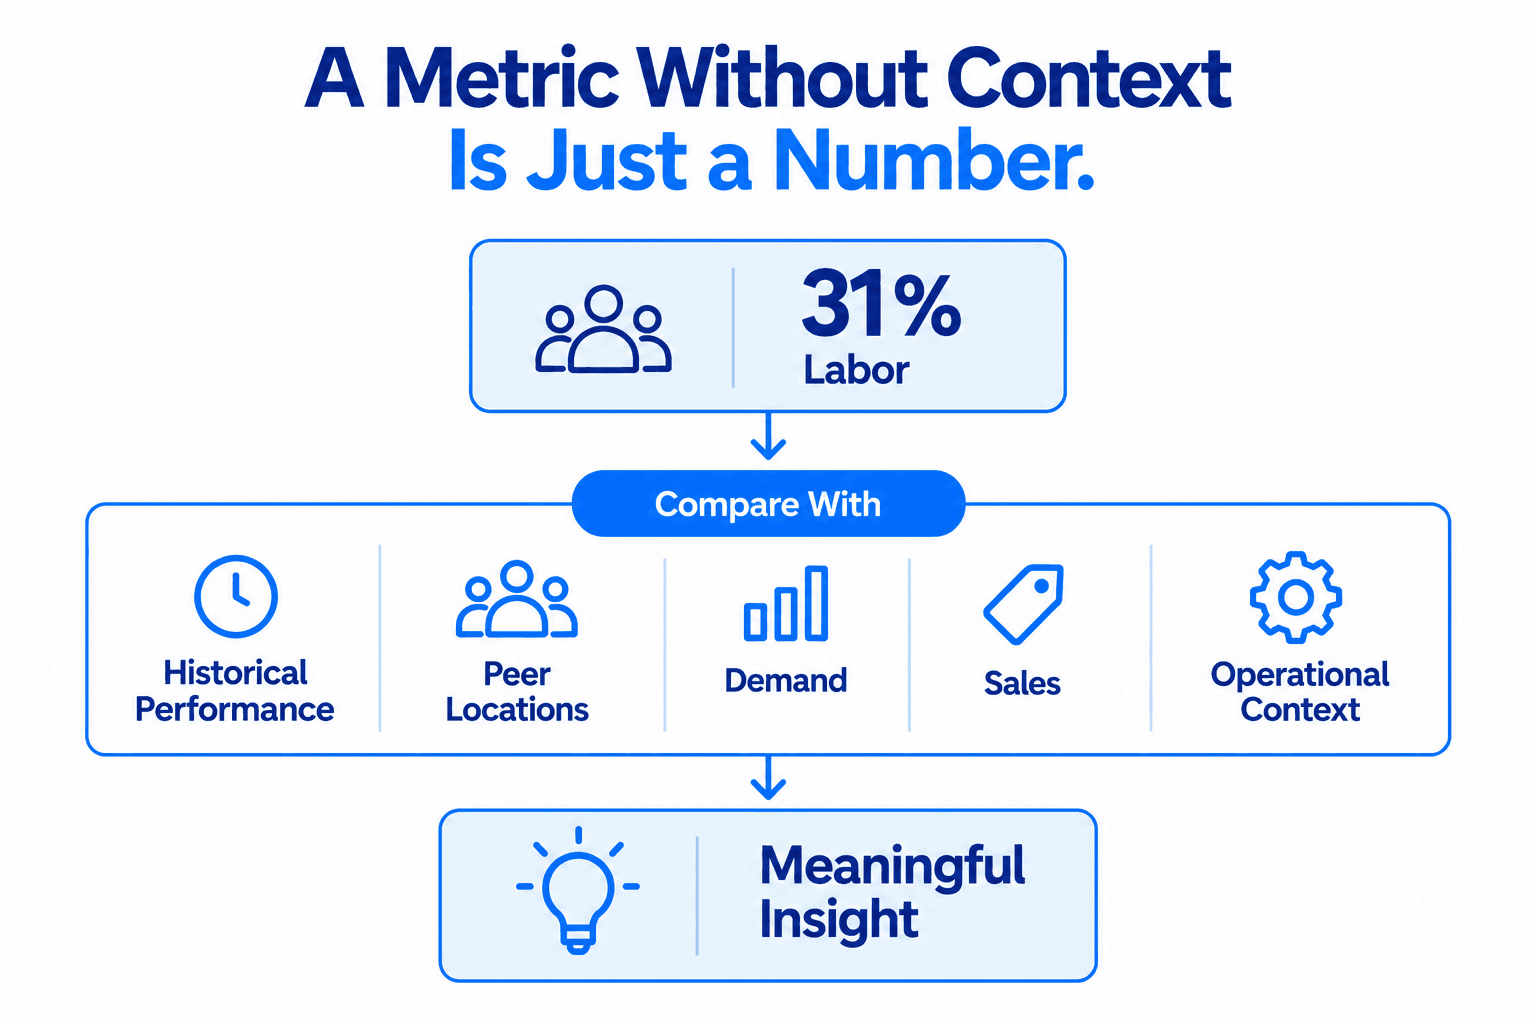
Restaurant groups frequently compare locations against the chain average.
But not all restaurants should perform identically.
A food-court restaurant has different economics from:
a drive-thru
an airport unit
a downtown restaurant
a delivery-heavy location
AI can potentially create more useful comparison groups based on:
format
geography
sales volume
maturity
channel mix
daypart mix
operating hours
Instead of:
Your labor cost is 2 points above the network average.
the analytical system could say:
Your labor cost is 2.4 points above comparable high-volume urban restaurants with similar delivery penetration.
That context makes the benchmark more credible.
It also supports the broader concept described in the Restaurant Command Center.
The purpose is not simply to rank restaurants.
It is to identify meaningful performance differences.
AI Analytics Can Connect Cause and Effect Across Systems
This is where restaurant analytics becomes strategically valuable.
A restaurant may have several apparent problems:
sales declined
labor percentage increased
ticket times increased
refunds increased
Traditional systems can report each one.
AI can help investigate whether they are connected.
For example:
Higher digital demand
↓
Kitchen bottleneck
↓
Longer ticket times
↓
More cancellations and refunds
↓
Lower fulfilled sales
↓
Higher labor percentage
Leadership does not actually have five problems.
It has one underlying operational issue producing five symptoms.
This concept was central to the Restaurant Command Center.
The value of restaurant intelligence comes from moving beyond:
Which KPI is red?
toward:
What operating condition is producing these outcomes?
AI Analytics and Restaurant Demand Forecasting
Traditional reporting is backward-looking.
It asks:
What happened?
Forecasting extends analytics into the future.
As discussed in AI Restaurant Demand Forecasting, AI can use historical restaurant data and other signals to estimate future demand.
The analytics layer can then connect those predictions with current plans.
For example:
Tomorrow's lunch sales are forecast 17% above baseline.
That prediction becomes much more valuable when analytics asks:
Is enough labor scheduled?
Is inventory sufficient?
Which kitchen station is most likely to constrain throughput?
How does expected demand compare with similar days?
This creates the progression:
Historical analytics
What happened?
↓
Diagnostic analytics
Why did it happen?
↓
Predictive analytics
What is likely to happen?
↓
Prescriptive analytics
What should we consider doing?
That is the broader evolution of restaurant analytics.
Analytics Can Make Labor Reporting More Useful
Traditional labor reports typically show:
hours
labor cost
overtime
labor percentage
scheduled versus actual
Those metrics matter.
But the more useful question is:
Why did labor perform differently from plan?
Possible explanations include:
demand forecast was wrong
manager scheduled too many hours
unexpected call-outs caused overtime
sales fell unexpectedly
kitchen complexity required additional labor
staffing was shifted between dayparts
AI analytics can examine those relationships.
This complements the operating model described in AI Restaurant Labor Optimization.
The scheduling system helps determine labor requirements.
The analytical system helps determine whether the plan worked.
Analytics Can Make Inventory Reporting More Useful
Inventory reports frequently show:
inventory value
food cost
purchasing
waste
actual usage
theoretical usage
Again, the analytical question is:
What deserves investigation?
As discussed in AI Restaurant Inventory Management, a large variance between actual and theoretical usage can have several explanations.
AI analytics can potentially surface patterns such as:
Chicken variance occurs primarily on weekend dinner shifts.
or:
Waste increased after the new menu item launched.
or:
Purchasing increased despite relatively stable transaction volume.
The analytics layer helps turn inventory numbers into operational questions.
Analytics Can Make Kitchen Data More Useful
Kitchen systems generate valuable operational information.
Examples include:
ticket times
order volume
station workload
cancellations
preparation times
Traditional reporting may show average ticket time.
AI analytics can go deeper.
For example:
Ticket time deteriorates when digital orders exceed 38% of total order volume between 12:00 and 1:00 p.m.
That relationship can then influence:
staffing
kitchen preparation
menu strategy
delivery settings
This creates a direct connection with AI Kitchen Orchestration.
Analytics identifies the pattern.
Orchestration helps operators respond to it.
Natural-Language Analytics Changes Who Can Use Data
Traditional business intelligence often requires specialized skills.
Someone needs to:
build the report
understand the dimensions
create filters
interpret charts
export data
Natural-language interfaces reduce that barrier.
A district manager might ask:
Which stores had unusual refund activity this weekend?
A CFO might ask:
Which locations experienced food-cost deterioration without a corresponding change in menu mix?
A COO might ask:
Which restaurants are showing both rising ticket times and declining transaction volume?
A franchise owner might ask:
Why did my third location underperform the other two this month?
The underlying analytical complexity may be significant.
But the interface is simply a question.
Toast's Q1 2026 data indicates operators are already using conversational AI in this way. Sales and revenue were the most common category of operator questions, followed by menu and inventory, guest and marketing, and operations and reporting.
Daily Briefings May Replace the Morning Dashboard Routine
One particularly interesting finding from Toast's 2026 data is that the most common operator prompt was:
“Create a short, easy-to-read daily briefing for my restaurant.”
Toast analyzed activity from more than 125,000 U.S.-based restaurant locations using Toast IQ in Q1 2026.
The significance is larger than the prompt itself.
It indicates what restaurant operators really want.
Not necessarily:
Give me more charts.
But:
Tell me what I need to know.
For a multi-location organization, an executive briefing could look like:
Network Summary
Sales: +3.1% vs comparable period
Labor: 0.6 points better than plan
Digital sales: +8.2%
Requires Attention
Location 28
Dinner transactions declined 12%.
Primary change: delivery order volume.
Location 73
Overtime materially above normal range for third consecutive week.
Location 104
Inventory variance increased across two high-cost ingredients.
Emerging Opportunity
Six comparable locations increased average ticket after adopting the same modifier strategy.
That is analytics delivered as a management tool rather than a reporting tool.
AI Analytics Should Lead to Management by Exception

The more locations a restaurant organization operates, the less practical universal reporting becomes.
A VP of Operations responsible for 200 restaurants should not analyze all 200 equally.
Most are probably operating within acceptable ranges.
The system should identify the exceptions.
This is the management model described in Restaurant Management by Exception.
AI analytics enables that approach by continuously comparing:
Expected
vs
Actual
and asking:
Is the difference important enough to require human attention?
The ideal analytical system is not the one generating the most alerts.
It is the one generating the fewest high-quality alerts possible without missing material problems.
Restaurant Analytics Should Also Find Opportunities
Analytics should not only search for problems.
That creates an unnecessarily defensive operating model.
AI can also identify:
high-performing menu items
successful promotions
profitable dayparts
operational best practices
locations outperforming peers
successful upselling patterns
emerging demand
For example:
Seven stores that repositioned a beverage bundle within online ordering increased beverage attachment materially compared with similar locations.
The system could surface this as:
Opportunity: test this merchandising pattern across comparable stores.
This creates a different form of management by exception.
Not:
Which restaurant is failing?
But:
Which restaurant has discovered something the rest of the network should learn from?
That becomes particularly powerful across large franchise networks.
What Restaurant Executives Should Ask Their Analytics Platform
Instead of asking only whether the platform has dashboards, leadership should ask whether it can answer progressively more valuable questions.
Level 1: Reporting
Can it tell us what happened?
Level 2: Comparison
Can it show where performance differs?
Level 3: Explanation
Can it help identify what changed and what may be driving it?
Level 4: Prediction
Can it tell us what is likely to happen?
Level 5: Prioritization
Can it tell us which issue matters most?
Level 6: Recommendation
Can it suggest what we should investigate or consider doing?
The higher the system moves through these levels, the more it becomes a restaurant intelligence platform rather than simply a reporting system.
The Risk of AI Hallucinations in Restaurant Analytics
AI analytics introduces a new risk.
A traditional report may be difficult to interpret.
But at least the numbers are visible.
An AI-generated explanation can sound confident even when its interpretation is wrong.
Restaurant operators therefore need analytical safeguards.
AI-generated answers should ideally:
remain grounded in verified restaurant data
show the metrics supporting the conclusion
identify comparison periods
disclose uncertainty
allow users to inspect underlying data
distinguish facts from interpretation
For example:
Weak output:
Sales declined because staffing was poor.
Better output:
Sales declined 7.4% during dinner while ticket time increased 16% and scheduled labor was 9% below forecast requirement. These metrics suggest staffing capacity may have contributed to the decline, but additional investigation is required.
The second answer is more useful because it explains the evidence and preserves uncertainty.
Data Quality Still Determines Analytical Quality
AI does not eliminate the need for accurate data.
It increases it.
If:
stores use inconsistent menu structures
orders are missing from certain channels
time clocks are inaccurate
inventory counts are unreliable
refunds are incorrectly categorized
then AI analysis will inherit those problems.
A sophisticated model analyzing bad restaurant data can produce sophisticated-looking bad conclusions.
This is why the concept established throughout the MYR AI series remains important:
Connected, standardized operational data is the foundation of reliable restaurant intelligence.
Where MYR Fits Into Restaurant Analytics
MYR already centralizes important operational information for quick-service restaurants.
Its role is particularly relevant because useful analytics depends on having complete transaction and operating data across channels.
MYR supports capabilities including:
POS transactions
online ordering
third-party delivery integrations
multi-location reporting
centralized menu management
kitchen workflows
location-level performance visibility
franchise management
MYR's Order Processing capabilities help bring third-party delivery orders into the same operational flow rather than forcing restaurants to manage each channel independently.
For franchise and multi-location organizations, MYR's franchise platform provides centralized reporting and control across locations.
The strategic opportunity is clear.
The stronger the connected operational foundation becomes, the more valuable the intelligence layer above it can become.
MYR should not overstate this by claiming every analytical concept described here exists today as autonomous AI functionality.
The stronger positioning is:
MYR provides the connected QSR operational foundation required for increasingly intelligent restaurant analytics and decision-making.
That remains credible while moving the brand beyond the perception of a simple transaction system.
From Reports to Restaurant Decision Intelligence
Restaurant analytics is evolving through several stages.
Static Reports
↓
Real-Time Dashboards
↓
Interactive Analytics
↓
AI Summaries
↓
Conversational Analytics
↓
Predictive Insights
↓
Decision Intelligence
At the final stage, analytics does not disappear.
It becomes less visible.
Instead of asking executives to continuously review data, the system monitors the business and brings forward what deserves attention.
This is the architecture behind the Restaurant Command Center.
Reporting provides the facts.
Analytics provides understanding.
Prediction provides foresight.
Management by exception provides focus.
The Command Center brings them together.
More Data Is Not the Goal
Restaurant software vendors have spent years adding more information.
More charts.
More metrics.
More filters.
More reports.
That was valuable when data was difficult to obtain.
But executives are increasingly facing the opposite problem.
Information overload.
The next generation of restaurant analytics should therefore measure success differently.
Not:
How many KPIs can we show?
But:
How quickly can we help someone understand the business and make the right decision?
This is why the future restaurant dashboard may actually contain less information.
Because the intelligence underneath it is doing more work.
The Future of Restaurant Reporting
Traditional restaurant reporting will not disappear.
Businesses still require:
financial reports
sales reports
audits
transaction records
labor reports
compliance information
But reporting becomes the foundation rather than the endpoint.
Above it sits an increasingly intelligent analytical layer that can:
summarize
compare
investigate
predict
prioritize
The most important transition is therefore not:
Reports to AI.
It is:
Reports to decisions.
AI is simply making that transition possible at a scale that was previously difficult for restaurant organizations to achieve.
Conclusion
Restaurant reporting answers an essential question:
What happened?
But multi-location restaurant operators increasingly need answers to more difficult questions.
Why did it happen?
Is it unusual?
Is it happening elsewhere?
What is likely to happen next?
Which problem matters most?
Where should leadership focus?
Artificial intelligence can help restaurant analytics move into that territory.
The shift is already visible.
Restaurant365 now provides AI-generated dashboard summaries, natural-language answers, and AI-driven operational insights. Toast reports that restaurant operators are increasingly using conversational AI to analyze sales, labor, menu, inventory, and operational performance.
For QSR franchise owners and enterprise restaurant groups, the long-term value is not simply faster reporting.
It is faster understanding.
Reports tell you what happened. Restaurant intelligence helps you decide what matters next.
Build the Data Foundation for Smarter Restaurant Decisions
AI analytics becomes more useful when restaurant data is connected.
MYR helps quick-service restaurant brands centralize POS transactions, online ordering, third-party delivery, kitchen workflows, menu management, reporting, and multi-location operations through one cloud-based platform.
Explore MYR for QSR Franchises
Frequently Asked Questions
What is AI restaurant analytics?
AI restaurant analytics uses artificial intelligence to analyze restaurant operational data, identify trends and anomalies, explain performance changes, answer questions, forecast outcomes, and help operators prioritize decisions.
What is the difference between restaurant reporting and restaurant analytics?
Restaurant reporting primarily organizes and displays historical data. Restaurant analytics interprets that data to understand relationships, trends, performance drivers, and potential causes.
How is AI restaurant analytics different from a dashboard?
A dashboard primarily displays metrics and visualizations. AI analytics can summarize those metrics, answer questions about them, identify unusual patterns, connect related signals, and potentially predict future outcomes.
Can restaurant operators ask AI questions about their data?
Yes. Some restaurant technology platforms now support conversational analytics. Restaurant365 offers AI-generated answers based on dashboard information, while Toast IQ allows operators to ask questions grounded in restaurant sales, labor, menu, guest, and operational data.
What restaurant data can AI analyze?
Depending on the systems connected, AI analytics can potentially analyze sales, transactions, labor, menu performance, kitchen activity, inventory, delivery, refunds, discounts, customer behavior, and multi-location performance.
Can AI explain why restaurant sales declined?
AI can identify patterns and relationships that may help explain a decline, such as changes in transactions, average ticket, menu availability, labor, or ordering channels. Human operators should still validate whether those relationships represent the actual cause.
What is anomaly detection in restaurant analytics?
Anomaly detection identifies results that differ materially from a restaurant's normal performance or an appropriate benchmark. It can help operators identify unusual changes even when a fixed KPI threshold has not been crossed.
How can AI analytics help restaurant franchises?
AI can compare franchise locations, identify exceptions, create more relevant peer benchmarks, detect recurring operational problems, and help corporate teams prioritize franchisees requiring support.
Can AI restaurant analytics replace restaurant managers?
No. AI can analyze data and provide recommendations, but managers provide operating context, judgment, accountability, and knowledge that data alone may not capture.
Why is connected restaurant data important for AI analytics?
AI can only analyze the information available to it. Connecting POS, digital ordering, delivery, kitchen, labor, and other operational data gives the analytical layer a more complete view of restaurant